
Tuesday, February 28, 2017
Wednesday, February 15, 2017
For Richer, Not for Poorer, Not in Sickness, Only in Health
According to a recent survey,
the top reason cited for couples getting divorced is “basic incompatibility”
followed by “infidelity.” However, one reason couples may separate has no connection
to their feelings for each other—one of them being diagnosed with an expensive
illness. Though it may seem heartless to divorce your sick partner, the
practice of “medical divorce” frequently made financial sense if they were
uninsured. Prior to the enactment of the Affordable Care Act (ACA), if one spouse
became sick and needed expensive treatments, the couple would have to drain
their savings (including retirement) before the partner qualified for Medicaid.
By divorcing, the healthy partner could retain their retirement account and
savings while having the sick partner qualify sooner.

Under the ACA, Medicaid expanded.
The income levels at which adults could qualify were set at 138% Federal
Poverty Level (FPL) and did not take assets into account. Different types of
people also qualified, including childless adults. However, due to the Supreme
Court’s Ruling in National Federation of Independent Business v. Sebelius, not
all states were required to expand. Roughly half did not. The silver lining of this was that researchers are
now able to use this exogenous variation in order to analyze the effects of
expanding Medicaid. In a recent NBER Working Paper, “Did Medicaid Expansion ReduceMedical Divorce” David Slusky and Donna Ginther use it to examine the effect of
Medicaid expansion on Medical Divorce. Their results seem to suggest a decrease
in Medical Divorce as a result of Medicaid Expansion. Some good news for
Valentine's Day.

Slusky and Ginther run what is
called a difference-in-difference estimation. This separates everyone they
study (50-64 year olds) into two groups—those who live in expansion states and
those who do not. It also separates the sample by time “before 2014” when
Medicaid primarily expanded in and “after 2014.” They then are able to look at
the prevalence of divorce among people in Expansion States and Non Expansion
States both Before and After.
First, the researchers had to be
sure that whatever changes they saw in divorce rates couldn’t be attributed to
something else. Perhaps in 2014 something happens to make divorce rates change in
only Expansion States—like lower unemployment rates which caused lower divorce rates.
To help strengthen their findings they present the average Age, and
Unemployment Rate as well as the Prevalence of Divorce before and after in
control and treated states.

© 2017 by David Slusky and Donna Ginther
The average age in their control
group is roughly equal, as are the changes in the unemployment rate over time.
However, whereas the divorce rate becomes higher in the control states during
this time, the divorce rate in treated states increases. The “difference-in-difference”
of -0.94 can be interpreted as a .94 percentage point decrease in divorce prevalence
among those living in Medicaid Expansion states.

© 2017 by David Slusky and Donna Ginther
Their regression results are shown
above. Each numbered column adds a different treatment effect. Controlling for
treatment, year, state, month, and unemployment the results remain similar. By
doing this they account for the possibility that something else related to one
of those factors was actually the cause of the difference in the rates of
divorce.
The Medicaid Expansion appears to
have reduced the prevalence of divorce among those aged 50-64 by .94 percentage
points (or 5.6%) perhaps in part due to a lesser need for Medical Divorce.
Sunday, February 12, 2017
Worker Health and Minimum Wage Increases
Can
Increasing the Minimum Wage Make You Healthier?

It’s a
complex question. First, we have to determine how to measure health. Then, we
need to compare the health of a lot of folks who got minimum wage increases
against the health of a lot of folks who did not. And finally, we have to weed
out a variety of personal, social and even political issues that also affect
people’s health to make sure we isolate the true impact of minimum wage
increases.
That’s
exactly what Brady Horn, Joanna Maclean, and Michael Strain attempted to do in
their research working paper published by the National Bureau of Economic
Research in August 2016.
Using data
from 1993 to 2014 including 347,421 men and 377,520 women from ages 21 – 54,
the researchers studied the health impacts of minimum wage increases on workers
whose highest level of education is a high school degree.
But what is “health”
and how do you measure it? Think of your health like a car. When people are
born, you are a certain kind of car – some people are born as Fiat’s, Jeep’s or
Mitsubishi’s (not great health), some are born as Ford’s, Buick’s and Chevy’s
(decent health), and some are born as Lexus, Audi’s and Porsche’s (you get the
idea). But no matter what, all cars get older. And at times cars require
repairs. Sometimes, you want to upgrade your car, such as adding a new stereo system
or new tires. Since there are a lot of things to spend money on in life, you
have to decide how much to spend on your car and how much to spend on other
items. The same can be said for the health of individuals. This idea is
referred to as the Grossman Model, developed by Michael Grossman in 1972, and it
is widely accepted as an accurate economic health model.
So what does
the Grossman Model have to do with measuring health to answer our question? It
all comes down to investing in one’s health. Essentially the Grossman Model
predicts that as people get wealthier, they get healthier, because they invest
in their health through eating well, spending money on the doctor, and exercising,
to name a few examples. So, we’d be tempted to predict that as minimum wage
increases, people get healthier. But is it true?
Before we look
at the results, let’s weed out a lot of other factors that can influence
people’s health. The researchers in this study considered individual
characteristic, such as race and education, state characteristics (some states
are “healthier” than other states), state and national policies that could
affect the health of workers, and even month-by-month health trends (people are
sicker in certain months than in others). With these many factors controlled
for, we can begin observing the results.
In this study
health was measured through three survey questions. First, people were asked, ‘In
general, how would you rate your health?’ The possible responses are (1)
excellent or very good health and (2) fair or poor health. Second people were
asked, ‘Now thinking about your physical health, which includes physical
illness and injury, for how many days during the past 30 days was your physical
health not good?’ And similarly, people were asked, ‘Now thinking about your
mental health, which includes stress, depression, and problems with emotions,
for how many days during the past 30 days was your mental health not good?’ These
questions are subjective, and the researchers recognize this fact, but point
out that these self-reported health measures have also been proven to be
directly related to real objective health effects, like mortality, in almost a
dozen other studies.
So, here are
the results. For men who did not
experience a minimum wage increase, “50% report their health as very good or
excellent while 13% report their health as fair or poor. The average number of
days in the last 30 on which men report their physical and mental health was
not good is 2.01 and 2.72. Turning to women, 51% report their health as very
good or excellent, 14% report their health as fair or poor, and the average
number of days in the last 30 on which physical and mental health are reported
as not good is 2.67 and 4.21.”

And now
let’s compare to those who did experience
a minimum wage increase, and for the sake of this study, an increase of $1 per
hour. The amount of employed men who reported their health as fair or poor was
6% higher, at 19% versus 13%. However, employed men also reported that they
experienced 0.12 fewer bad mental health days, 2.60 versus 2.72. There is no discernible
change for any of the health measure among employed women.

It is not
clear from this study that increases in minimum wage have any positive effects
on workers’ physical health. In fact, there may be evidence to suggest that
minimum wage increases have a negative effect on workers’ physical health.
However, the study may also show that workers’ mental health is improved by an
increase in minimum wage.
There are a
number of factors considered by the researchers, which could explain why an
increase in minimum wage does not have a clear positive effect on workers’ physical
health. First, additional income may not be spent on healthy foods or
lifestyles. People may spend money on health-harming products, such as alcohol
or cigarettes. Second, many minimum wage earners provide a second source on
income for their families, meaning that the family as whole, and the family’s
health, may not be effected by an increase in the minimum wage. Third, as
minimum wages increase, opportunity for work decreases, and this may offset the
effects of a wage increase as fewer jobs are available.
The study
does show, however, that increases in minimum wage do positively affect mental
health for workers on the whole. As people make more money, people’s financial
worries diminish.
So, can
increasing the minimum wage make you healthier? It depends. You may worry less
about your finances, but it’s not clear that your physical health will improve.
In terms of physical health, the study is inconclusive. Many States throughout
the country are considering an increase to the minimum wage, and while this may
have many effects, a clear impact on physical health is not one of them without
further study.
-----------------
Source: Do Minimum Wage Increases Influence Worker Health? Brady P. Horn, Joanna Catherine Maclean, Michael R. Strain, Working Paper 22578, National Bureau of Economic Research, August 2016.
Effectiveness of Vaccination Public Policy
Vaccination is championed as one of the greatest successes in public health policy. Dramatic reduction and eradication of diseases is directly linked to vaccination implementation over the last century. Among the scientific and medical communities, vaccine effectiveness is not up for debate.

But vaccination rates in United States for many diseases fall well below goals set by Health and Human Services’ HealthyPeople2020 objectives. Increasing rates of vaccination has thus remained a top priority for public health officials.
There are challenges though. Whether it’s misplaced fear of links to autism fueled by misinformation or lack of access and information.
Even in the face of dangerous outbreaks, public sentiment and action can remain staunchly opposed to vaccination.
This is where strong public policy should come in. Recent research suggests the high effectiveness of both official recommendations and child mandates for vaccinations.
Emily Lawler from Vanderbilt University’s Department of Economics recently provided new research that examines the effects of hepatitis A vaccination policies on both the rate of vaccination of young children and on population disease incidence.
As she notes, it’s unclear in theory the extent to which vaccination policies are effective:
The two policies studied were official recommendations made by the Advisory Committee on Immunization Practices (ACIP) and hepatitis A child care/kindergarten mandates.
Unlike other vaccines, ACIP hepatitis A recommendations were incrementally implemented across states. Mandate implementation in states also varied significantly over time. Both of these reasons allowed Ms. Lawler to make important state level comparisons.
She tests the effects of ACIP recommendations and mandates on immunization rates first:

The results show large and statistically significant increases in immunization rates. Panel A Column 2, which controls for state and fixed year effects and state-specific linear trends, shows an increase of 27.3 percentage points for strong ACIP recommendations and 19.3 percentage points for weak ACIP recommendations. A further 8.18 percentage point increase is the result of a vaccine mandate in a state.
She then tests the effects of ACIP recommendations and mandates on the rate of hepatitis A in the population:

These results also show large and statistically significant effects. Column 3, which controls for state and fixed year effects, state-specific linear trends, and time-varying controls, shows a decrease in incidence of hepatitis A by 4.3 cases/100,000 people for strong ACIP recommendations and 3.3 cases/100,000 people. In addition, a mandate in a state further reduced cases by 1.5/100,000 people.
The obvious limit to this study is that hepatitis A is the only disease studied. As the author notes, hepatitis A is generally asymptomatic for children. Therefore, parents might make different vaccination choices with diseases that are more immediately dangerous to children.
Even so, all of this suggests the value and importance of strong vaccination policies on disease prevalence and immunization rates.

But vaccination rates in United States for many diseases fall well below goals set by Health and Human Services’ HealthyPeople2020 objectives. Increasing rates of vaccination has thus remained a top priority for public health officials.
There are challenges though. Whether it’s misplaced fear of links to autism fueled by misinformation or lack of access and information.
Even in the face of dangerous outbreaks, public sentiment and action can remain staunchly opposed to vaccination.
This is where strong public policy should come in. Recent research suggests the high effectiveness of both official recommendations and child mandates for vaccinations.
Emily Lawler from Vanderbilt University’s Department of Economics recently provided new research that examines the effects of hepatitis A vaccination policies on both the rate of vaccination of young children and on population disease incidence.
As she notes, it’s unclear in theory the extent to which vaccination policies are effective:
The direct effect of the policies is straightforward: lowering a vaccine’s effective price or mandating its receipt should increase the demand for vaccination and decrease disease prevalence. If, however, vaccination demand is also a decreasing function of disease prevalence, then each of these policies further has the indirect effect of reducing vaccination demand through the reduction in disease incidence. As a result, the net effect of these hepatitis A vaccination policies on vaccination rates and disease prevalence is an empirical question.This is what makes the research a novel and important question of study.
The two policies studied were official recommendations made by the Advisory Committee on Immunization Practices (ACIP) and hepatitis A child care/kindergarten mandates.
Unlike other vaccines, ACIP hepatitis A recommendations were incrementally implemented across states. Mandate implementation in states also varied significantly over time. Both of these reasons allowed Ms. Lawler to make important state level comparisons.
She tests the effects of ACIP recommendations and mandates on immunization rates first:

The results show large and statistically significant increases in immunization rates. Panel A Column 2, which controls for state and fixed year effects and state-specific linear trends, shows an increase of 27.3 percentage points for strong ACIP recommendations and 19.3 percentage points for weak ACIP recommendations. A further 8.18 percentage point increase is the result of a vaccine mandate in a state.
She then tests the effects of ACIP recommendations and mandates on the rate of hepatitis A in the population:

These results also show large and statistically significant effects. Column 3, which controls for state and fixed year effects, state-specific linear trends, and time-varying controls, shows a decrease in incidence of hepatitis A by 4.3 cases/100,000 people for strong ACIP recommendations and 3.3 cases/100,000 people. In addition, a mandate in a state further reduced cases by 1.5/100,000 people.
The obvious limit to this study is that hepatitis A is the only disease studied. As the author notes, hepatitis A is generally asymptomatic for children. Therefore, parents might make different vaccination choices with diseases that are more immediately dangerous to children.
Even so, all of this suggests the value and importance of strong vaccination policies on disease prevalence and immunization rates.
Monday, February 6, 2017
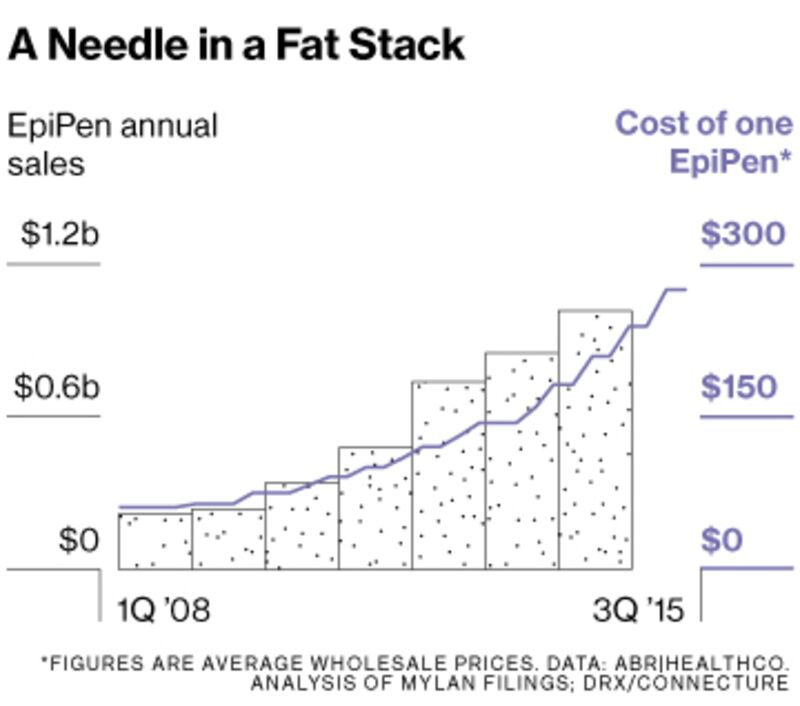
How EpiPen Prices Went Up By 400%
The EpiPen is an emergency injection of epinephrine administered when a person is having a severe allergic reaction. According to an article by Bloomberg, the EpiPen cost only $57 in 2007. Then drugmaker Mylan acquired the product and raised prices by over 400%. How does something like this happen? The company would say that it's because of their tireless work "over the past years advocating for increased anaphylaxis awareness, preparedness, and access to treatment,” Mylan spokeswoman Nina Devlin said in a statement.

Others disagree with this explanation. The EpiPen has increased in price more than almost any other drug over the past few years. Today, a 2-pack of EpiPens costs around $415 after insurance, or %608 without insurance. This can cause people and families to make dangerous decisions regarding their and their children's health.
One issue is that Mylan has a virtual monopoly on EpiPens. Because EpiPen is both an injector and a drug, there are many expensive tests that must be performed before the drug can be sold. The only real competitor to EpiPen, Sanofi's Auvi-Q, was voluntarily recalled because of possible mis-calibrations of dosages.
Another possible explanation is that EpiPen became available to students in schools even if they were not specifically prescribed to students through the School Access to Emergency Epinephrine Act of 2013 - which became colloquially called the EpiPen Act. This act was not created to specifically benefit EpiPen or Mylan, but because EpiPen has no direct competitors it most certainly did.
EpiPens are significantly more expensive today than they were less than 10 years ago. It is a lifesaving drug and Mylan has decided to raise its price by over 400%. Until a competitor enters the epinephrine auto-injector market, prices will likely stay high.
Subscribe to:
Posts (Atom)